plotFrames
- maelzel.distribute.plotFrames(xs, ids=None, top=1.0, bottom=0.0, durs=None, palette=None, edgecolor='black', ax=None, show=True)[source]
Plot a seq. of stacked frames
Imagine a section divided in measures. Each of these measures can be thought of as a frame. This function permits to visualize their relative duration by plotting these frames stacked to the left.
- Parameters:
xs – (seq) The start time of each frame
ids (
Optional[list[str]]) – (seq, optional) The id of each frame. Each id is plotted differentlytop – (number) The frames are defined between these y values. it only makes sense if plotting against something else, which shares the x coord
bottom – (number) The frames are defined between these y values. it only makes sense if plotting against something else, which shares the x coord
durs (
Optional[list[float]]) – (seq, optional) The duration of each section. If not given, it is assumed that the frames are non-overlapping, each frame ending where the next one begins. In this case, there are len(xs) - 1 number of frames (the last x value is used to determine the width of the last frame)palette (
Optional[list[str]]) – (seq) A list of colours, will be applied to the IDs as they are foundedgecolor – the color of the edges
ax – if given (a matplotlib.pyplot.Axes) this axes will be used to plot to
- Return type:
Axes- Returns:
the pyplot.Axes used
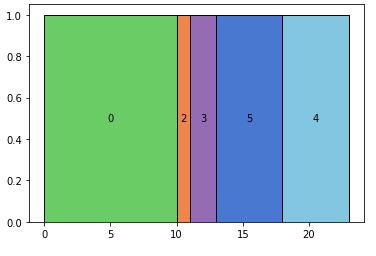
Example
>>> from maelzel.distribute import *
>>> sections = [0, 10, 11, 13, 18]
>>> ids =      [0, 0,   1,  0,  1]
>>> plotFrames(sections, ids)

>>> sections = [0, 10, 11, 13, 18]
>>> ids =      [0, 2,   3,  5,  4]
>>> plotFrames(sections, ids)