Sample (maelzel.snd.audiosample)
A Sample holds the audio data as a float64 numpy array, plus needed metadata like samplerate, number of channels and any other information contained in an soundfile. As a backend it uses soundfile
[25]:
from maelzel.snd.audiosample import Sample
from IPython.display import display
A Sample can be created either from the path to an soundfile, from a numpy.array or from another Sample
[30]:
s = Sample("snd/finneganswake.flac")
s
[30]:
16, sr=44100, numchannels=1)
Operations on Samples
Slice
Slicing returns a view into the source sample. That means that any modification in the slice will modify the source itself. Use .copy() to prevent modifying the source Sample
NB: notice that slicing does not work with sample indexes but with times. If you intend to slice by index you can access the .samples attribute and slice the array directly
[32]:
# Slice 1 second of audio, from 0:03 to 0:04, adjust the gain x3 (this returns a new Sample)

s[3:4] * 3
[32]:
1, sr=44100, numchannels=1)
[33]:
# Slice from 0:04 until 0:06 and apply a fadein / fadeout to a copy
s2 = s[4:6].copy().fade(0.2)
display(s2)

# A second copy, in reverse
s3 = s2.copy().reverse()
display(s3)
2, sr=44100, numchannels=1)
2, sr=44100, numchannels=1)
Sidenote: copy vs in-place
A Sample can be subjected to multiple operations: fadein, fadeout, normalization, gain, etc. Some operations are performed in place while others return a copy. In general, when the number of samples or the number of channels is modified, a copy is returned. Otherwise the operation is performed in-place
In place:
fade,normalize,reverseCopy: all others (
appendSilence,prependSilence,mixdown,stripLeft, …)
[21]:
s2 = s.copy().fade(3, shape='halfcos')
s2
[21]:
16, sr=44100, numchannels=1)
Plotting
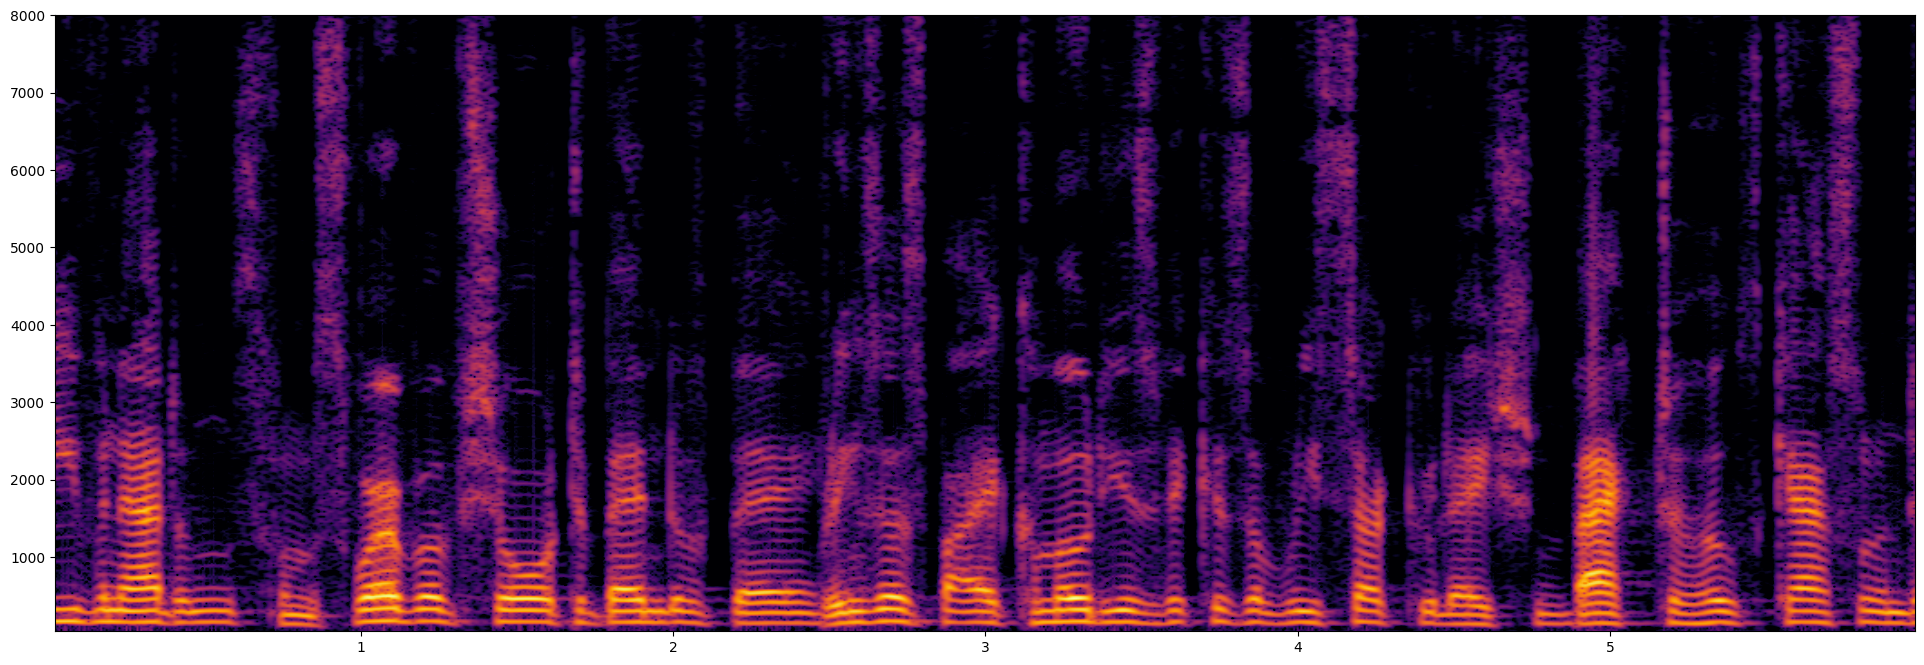
Spectrogram
Plot the spectrogram of a fragment (from second 1 to 7).
NB: slicing works with time, not with samples, so 1:7 means all samples with time >= 1 and < 7
[3]:
fragment = s[1:7]
fragment.plotSpectrogram(fftsize=2048, overlap=8, mindb=-100, maxfreq=8000)
[3]:
<Axes: >
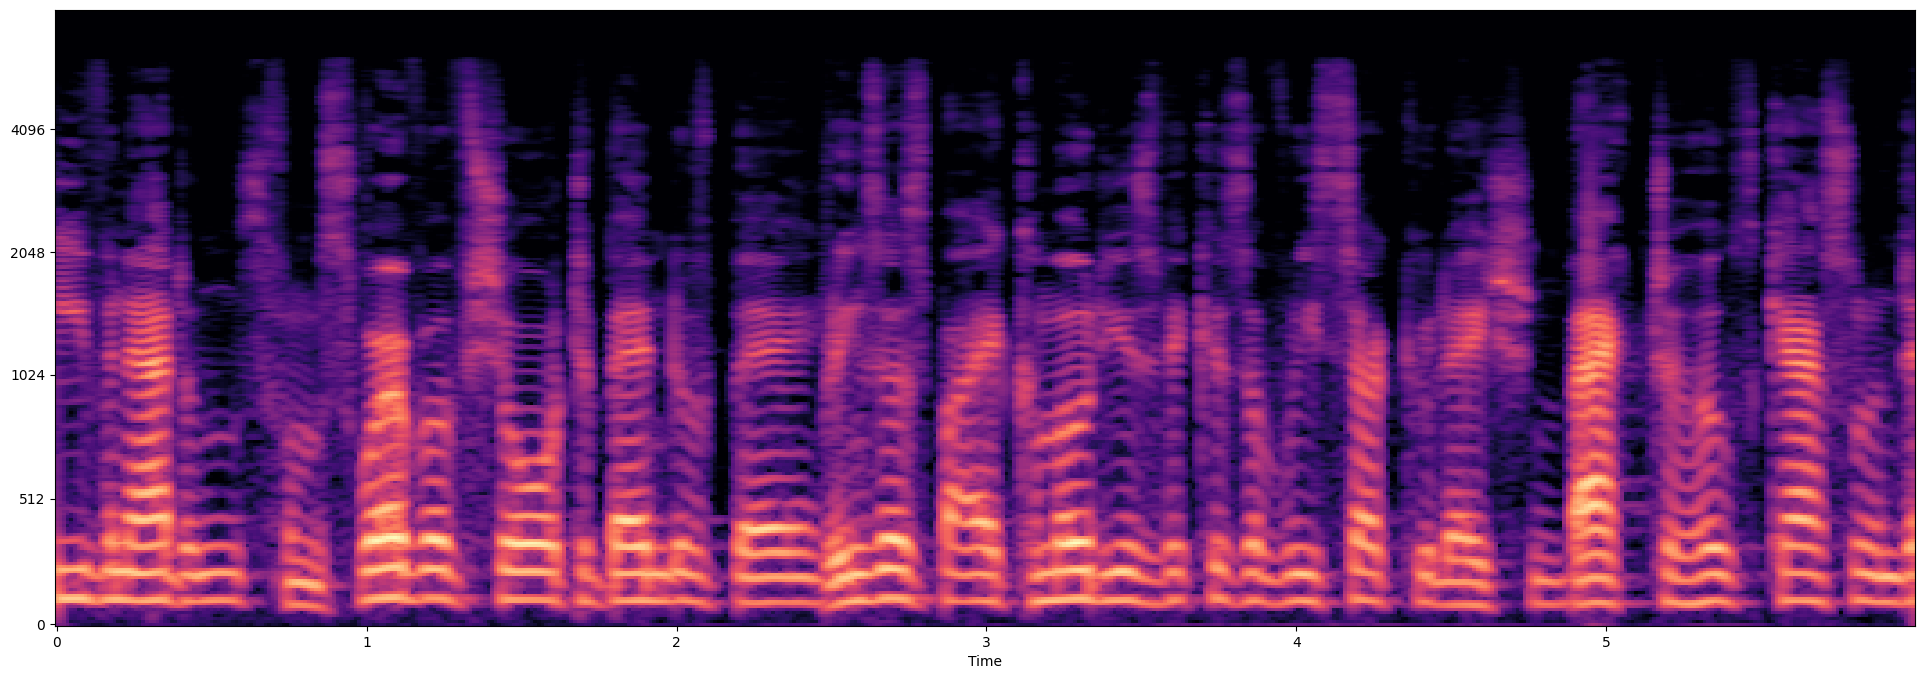
Mel Spectrogram
[7]:
fragment.plotMelSpectrogram(fftsize=4096, winlength=None, overlap=8, nmels=256, cmap='magma')
[7]:
<Axes: xlabel='Time'>
Playback
TODO
[ ]: